
Gill-T
-
Posts
7,287 -
Joined
-
Last visited
Everything posted by Gill-T
-
I will say it.........so we were told we would get a reduction of stockers per location because pen fish have better survival rates to adulthood, and then most of the plants we were offered don't actually make it to the pens as planned? WOW.
-

Wilson solo trip
Gill-T replied to RD9's topic in New York Fishing Reports - Lake Ontario (South Shore)
 Read this. http://www.fishchallenger.com/Docs/THELASTFRONTIER.pdf The interesting thing about this study is the night time position of kings at 50' down is similar to what I have witnessed on Ontario. Something magical about the 50' mark. When I had my boat slipped at Youngstown, I would stay out and try fish in the dark off the Niagara drop-off. As soon as it got dark, shaker kings would line up nose to tail on the graph 50' down. This phenomenon would play out over and over.
 -
Wilson solo trip
Gill-T replied to RD9's topic in New York Fishing Reports - Lake Ontario (South Shore)
I wonder if having a float hanging from their back kept them higher in the water column. I picture three and the rare 4 year old kings with their big bodies, resting on the denser 38 degree water mattress when they go inactive with the smaller bodied 1 and 2 year old kings resting on the thermocline. This study may change that. The Lake Huron study had transmitters within the body cavity and showed much deeper average depth.....like 120' deep. -
Wilson solo trip
Gill-T replied to RD9's topic in New York Fishing Reports - Lake Ontario (South Shore)
When you run through those crazy graphs your rigger rods should be pinging like they do when you go thru bait right? But they don't. Turn your gain down a little and watch that false picture disappear. -
Wilson solo trip
Gill-T replied to RD9's topic in New York Fishing Reports - Lake Ontario (South Shore)
I gathered the same from the study. The average temp they played in was like 55 degrees I believe. I cant remember if there was an age breakdown because I usually look for 48 degrees during summer when chasing bigs. I haven't studied if the temp was averaged over a season. If so ... the data may be misleading as the annual movement of kings into the niagara flow during spring will have them in 50 degree water all May. I need to look at the study -
Wilson solo trip
Gill-T replied to RD9's topic in New York Fishing Reports - Lake Ontario (South Shore)
When I get those crazy graphs in the spring, I turn the sensitivity down to weed out the small signals. I think a lot of what you are seeing is the result of the mud in the water, warm water species like adult gizzard shad, whitefish species, sheephead etc. I have spent a lot of time "not catching" over those mesmerizing graphs. Think about how your graph picks up the thermocline in the summer. It is measuring the subtle difference in water density. The same thing is most likely happening with the mud water and green water throwing off different density values. -
Thanks! Weather forecast sucks balls. Friekin snow possible?
-
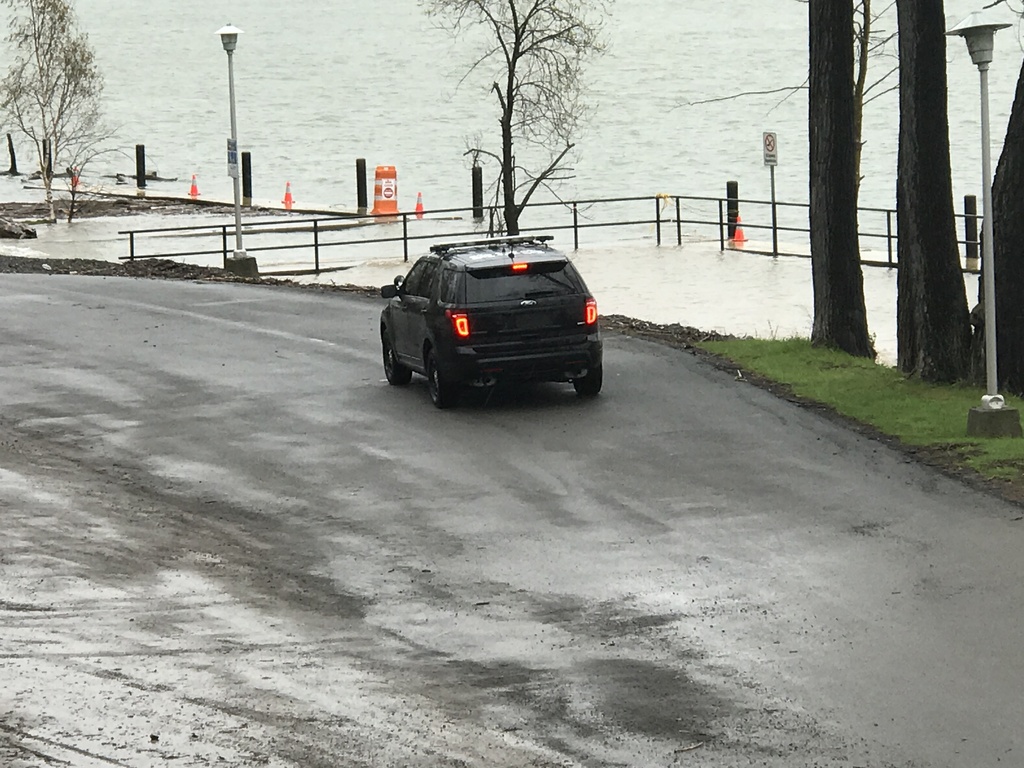
I guess we have to take warning when a marina advertisement claims to have "water hook-ups". Looks like someone left the hose on!!!
-
Olcott
Gill-T replied to fishslayer23's topic in New York Fishing Reports - Lake Ontario (South Shore)
They do gaggle up out near the elbow of the fence East of Toronto in September. They move up into steelhead water to feed on newly hatched alewives -
Niagara Bar?
Gill-T replied to Mikecatt14's topic in New York Fishing Reports - Lake Ontario (South Shore)
 Look up lineman.
 -
Niagara Bar?
Gill-T replied to Mikecatt14's topic in New York Fishing Reports - Lake Ontario (South Shore)
Above the Niagara West of Wilson. Go to light in town and turn down the hill to yacht club. Parking is up top .., as you pull up the hill make a left then quick right to park -
Erie is brown. Might go to some of my ditch mouth spots on Oneida or Chataqua and night cast.
-
Niagara Bar?
Gill-T replied to Mikecatt14's topic in New York Fishing Reports - Lake Ontario (South Shore)
Trailer up to the free Youngstown launch -
 A little wash of poop hitting the lake today!
 -
4/29 out of the oak
Gill-T replied to starweld20's topic in New York Fishing Reports - Lake Ontario (South Shore)
 Starweld, those look like Cohos.
 -
Olcott
Gill-T replied to fishslayer23's topic in New York Fishing Reports - Lake Ontario (South Shore)
Mayaaaaabe Mostly big beautiful coho. -
Olcott
Gill-T replied to fishslayer23's topic in New York Fishing Reports - Lake Ontario (South Shore)
Good bite off Olcott this morning. 48-58' FOW. Spoon bite. -
The Scotty stacker is fine on the cable.
-
You talking cheaters Pap or stacked additional lines?
-
Gordy, Canada has a lot of doomsday fishermen....... well respected fishermen. Please do some investigating and see if you can help spread the word that the sky is not falling despite what that misinformed gentleman Frank Krist from Michigan presented at The Credit River anglers symposium last year.
-
The data has not been compiled yet, but the early consensus is lots of adult alewives at a time when the first year of a predicted two year dip was suppose to materialize.
-
The zooplankton community over winter is Not limitless. Over winter the Mysids and Copepods mate from October thru November. In preparation for mating season the Copepods start storing lipid sacs. Mysids are as big as your index fingernail ( unless you snort coke). These are big fatty rich foods that help alewife fitness over winter. There population starts to plummet after breeding season so after December Alewives have to rely on low-fat phytoplankton. Plump alewives is a good indicator of the zooplankton community health. Dieoffs happen when the surviving alewives coming off the lean winter season are taxed further by their bodies starting to prepare eggs and sperm. Add a delayed spring and a delay to the new plankton cycle firing up and bingo they start succumbing to disease. THE ONLY WAY WE CAN MAINTAIN BALANCE IS MAKING SURE WE STOCK THE RIGHT AMOUNT OF KINGS. The lake is not getting cleaner. Look up the census data from the GTA (Greater Toronto Area) from 10 years ago and compare to now. Based on Sierra Defence Fund the average Canadian produces 63,000 liters of sewage per year. The amount of untreated sewage being dumped by Toronto and Hamilton in 1999 was 16 billion litres per year. With green water showing up on Lake Erie shores + the growth of the GTA, Lake Ontario is getting dirtier.
-
Warmest green water with bait showing on graph. They roam in loose schools constantly on the move terrorizing bait. Usually upper levels of water column.
-
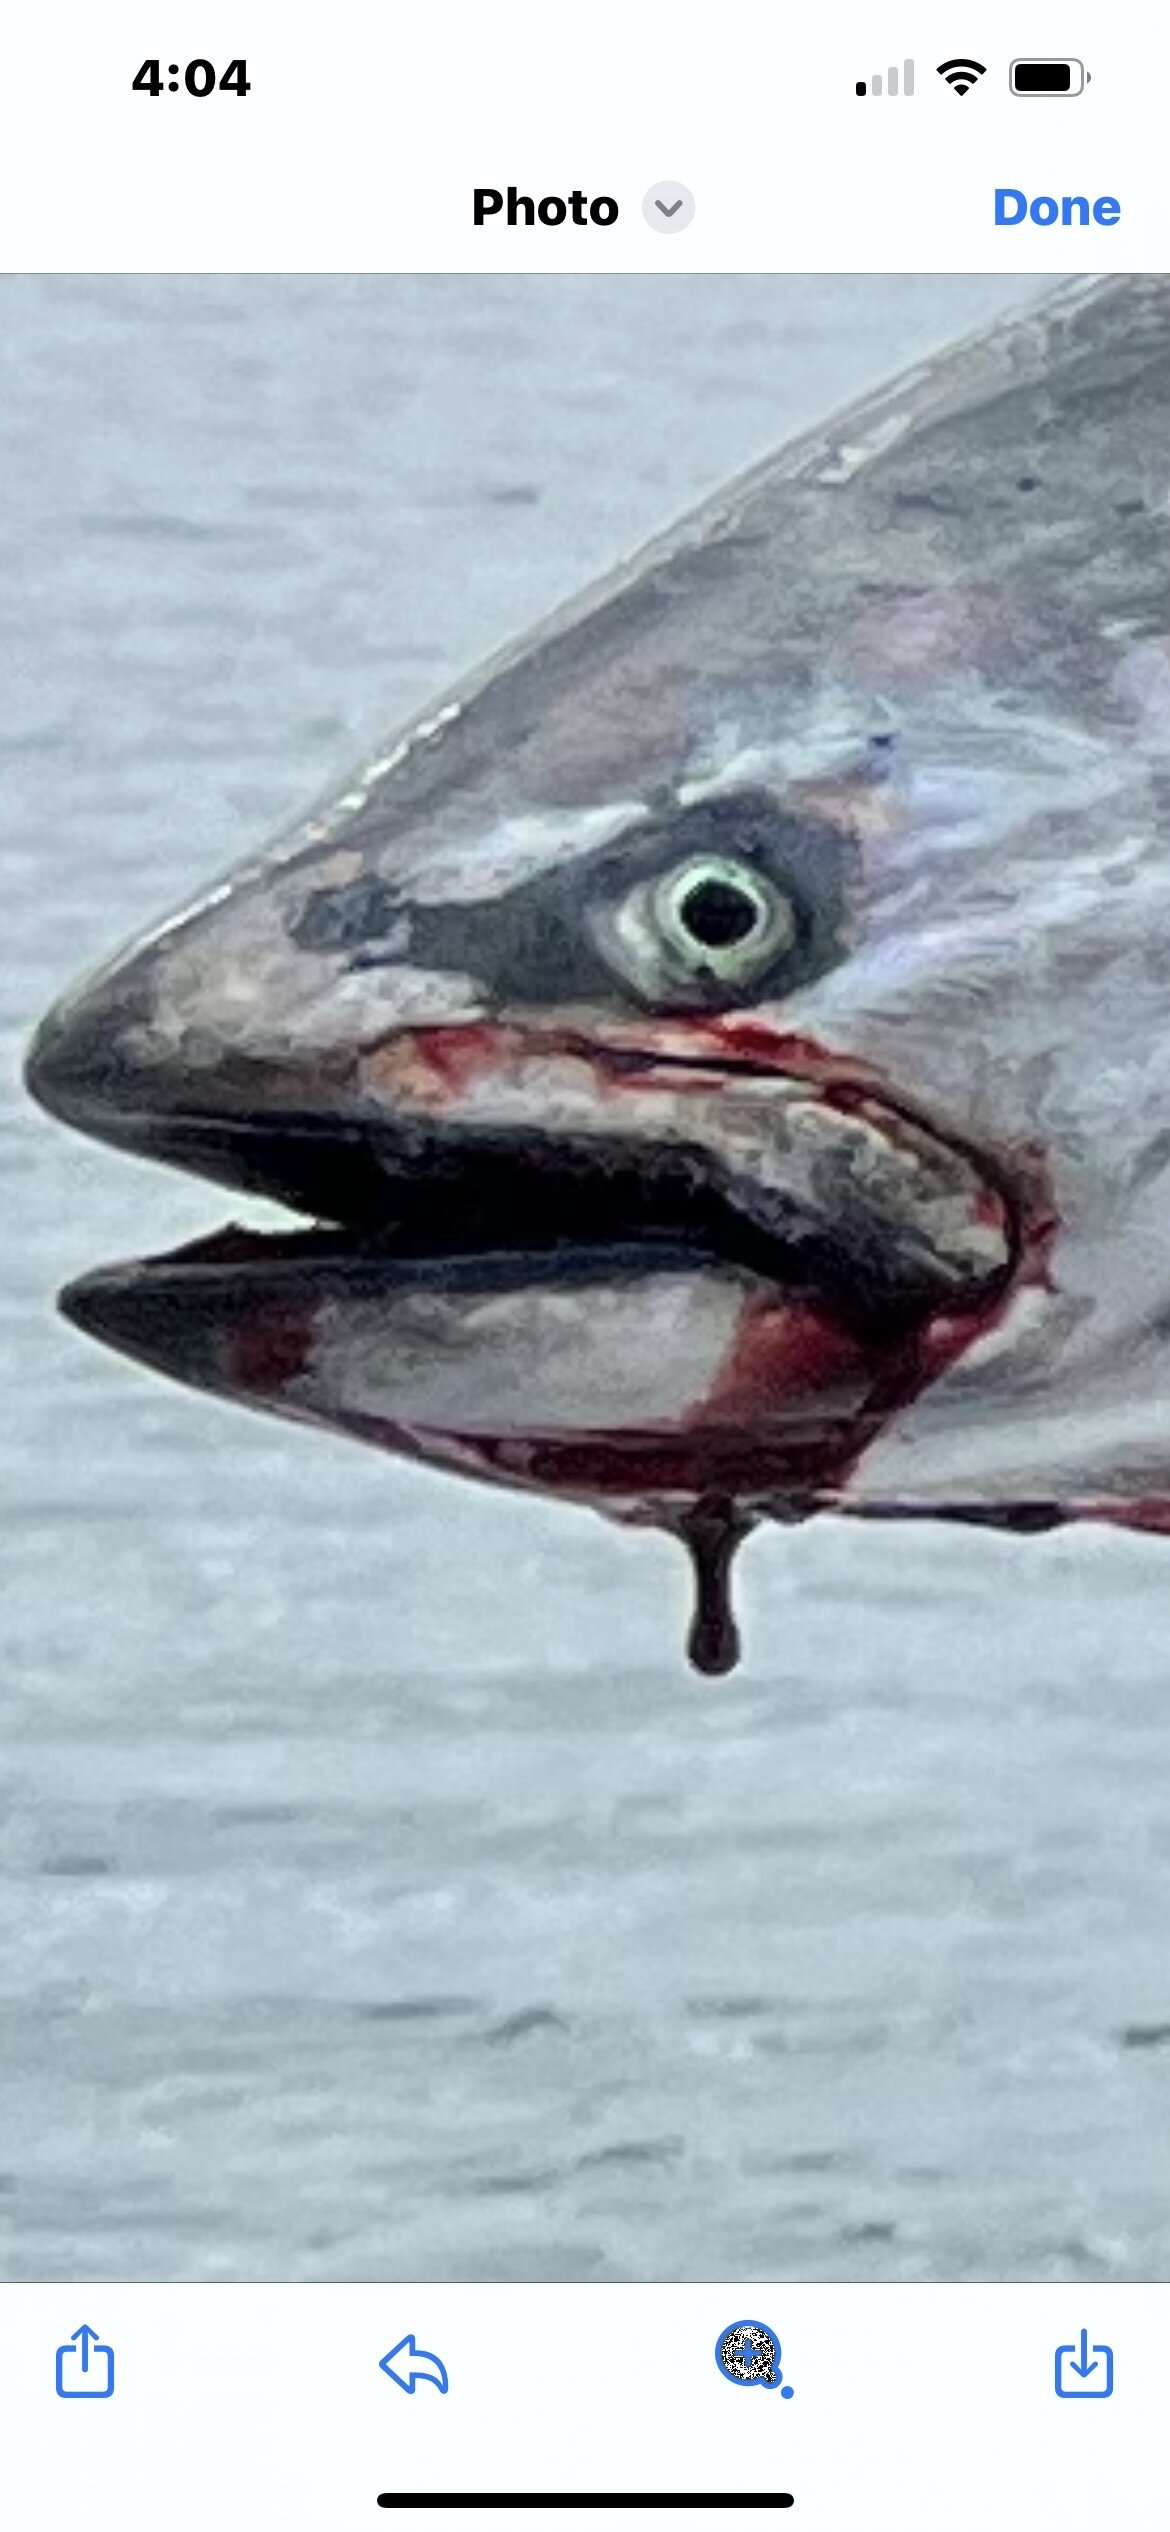
Well ...... he wouldn't win on good looks.
-
Junior thunderstick in UV firetiger- split ring removed/duolock snap 3.25" Northport Nailer in orange/ice glow on gold blank/ small single hook